Enrolment at a glance
See enrolment on the dashboard, without asking the office to count heads.


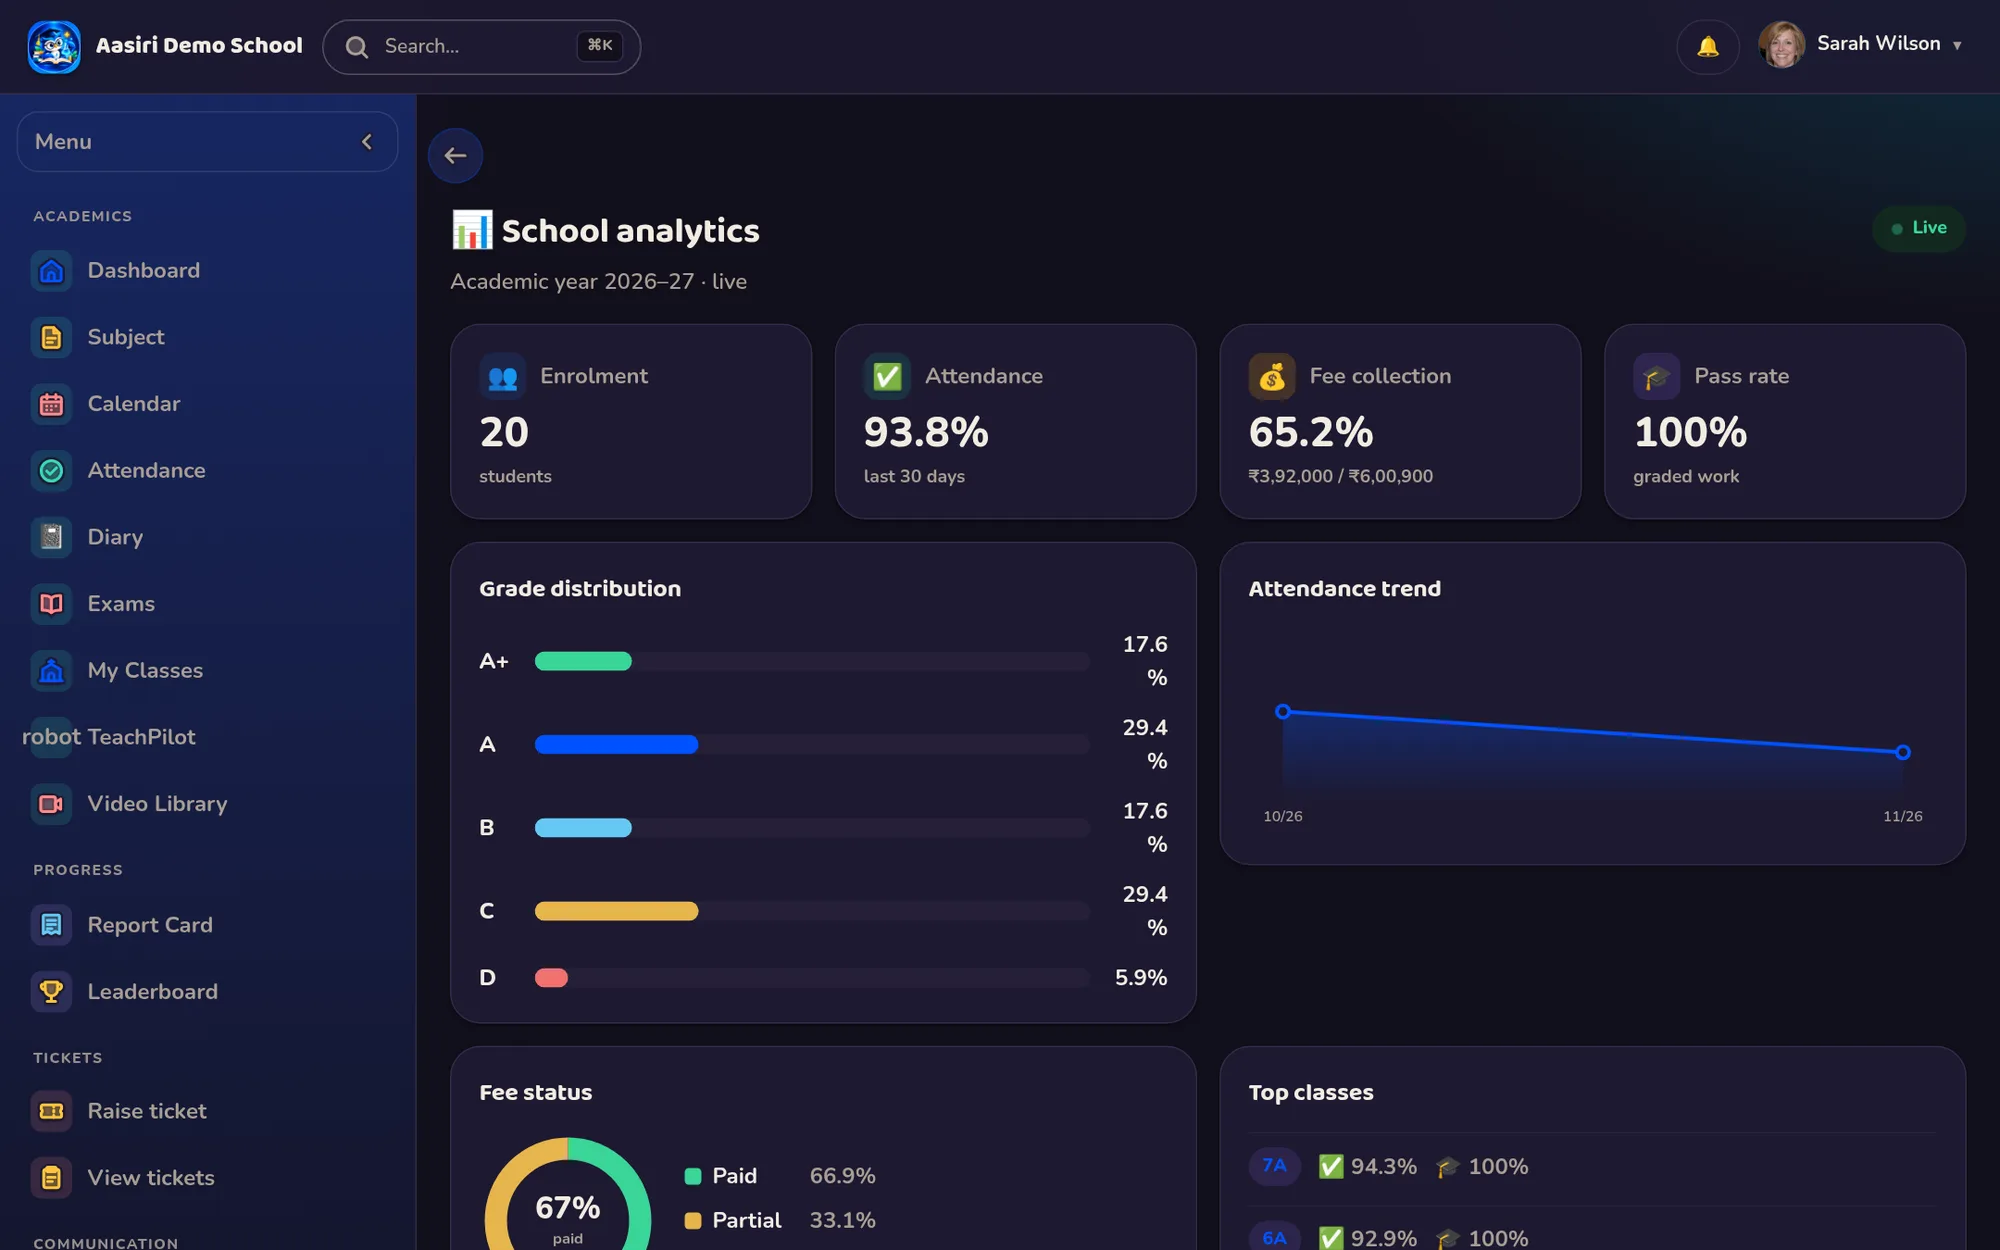
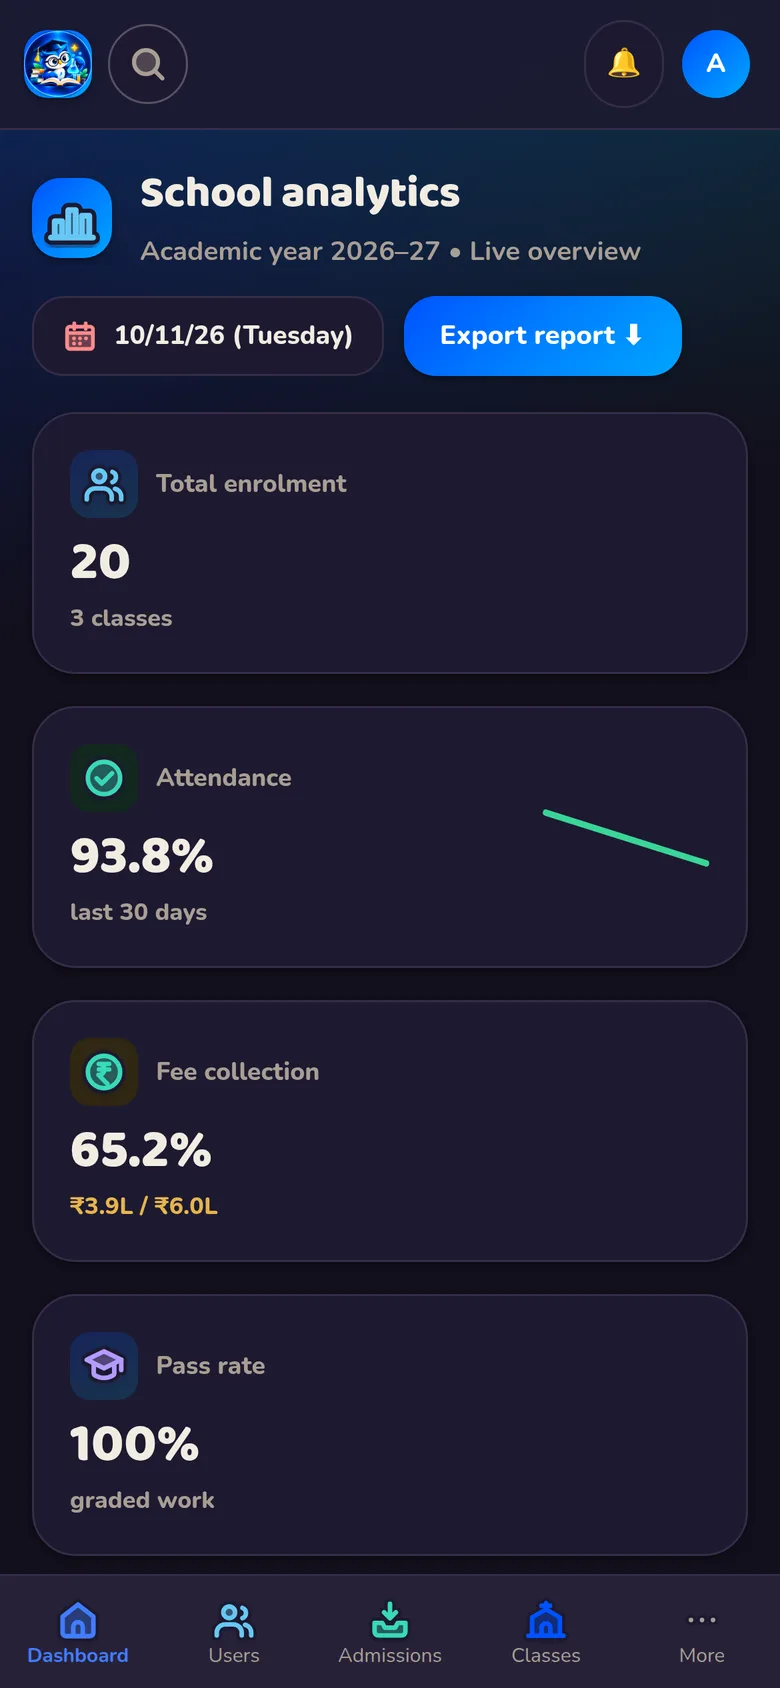
Enrolment, attendance trend, fee collection, pass rate, grade distribution and top classes, together on one screen. The figures come from the same records your teachers and office already keep in Aasiri.
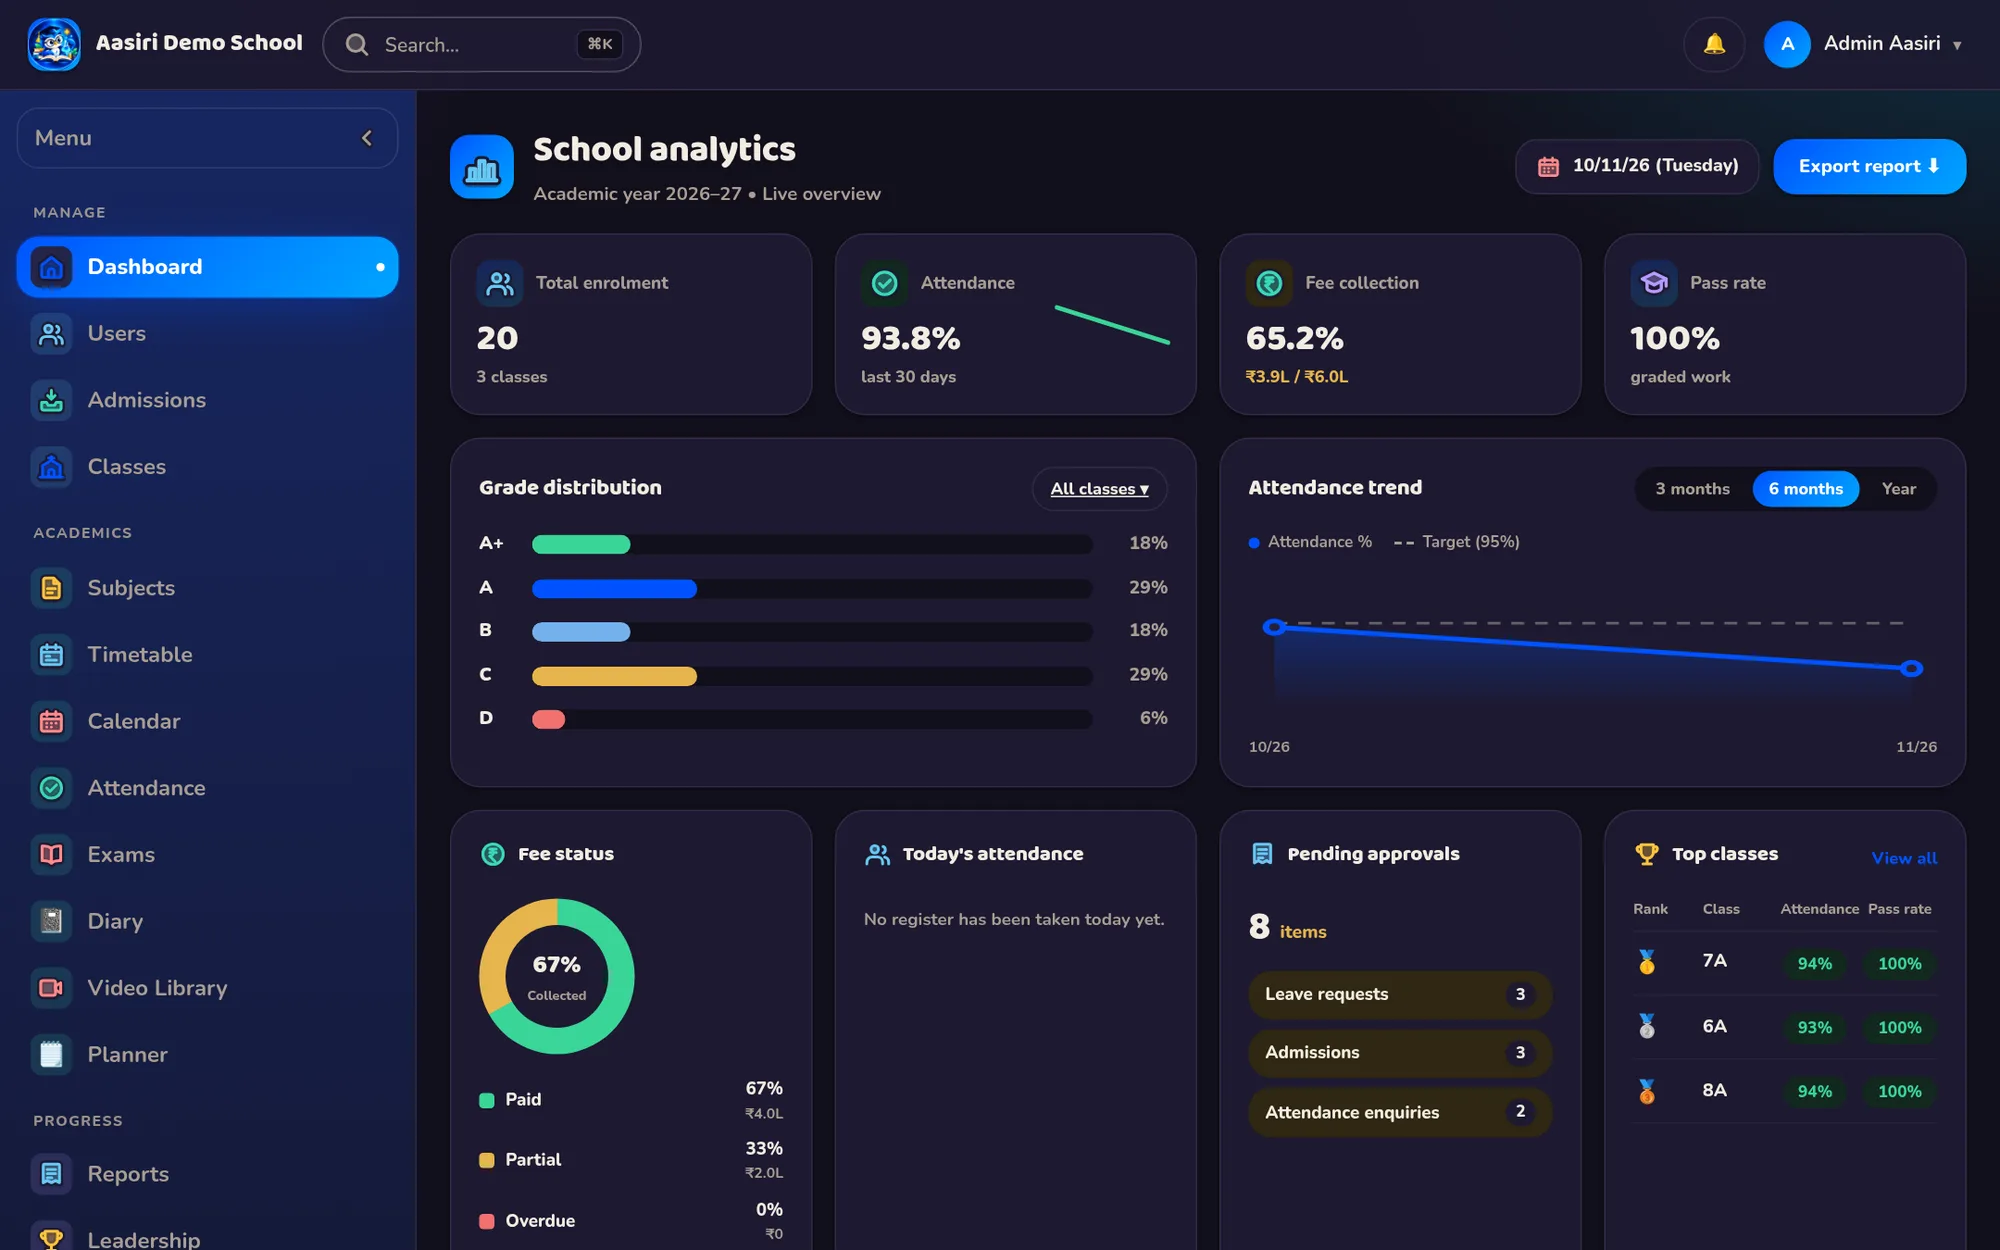
See enrolment on the dashboard, without asking the office to count heads.
Follow the attendance trend over time and notice when it dips.
Track fee collection alongside the rest of the school's numbers, drawn from the same fee records the accountant uses.
See the pass rate from entered exam marks, without waiting for a results summary to be compiled.
View how grades are spread across bands, so you can see where students cluster.
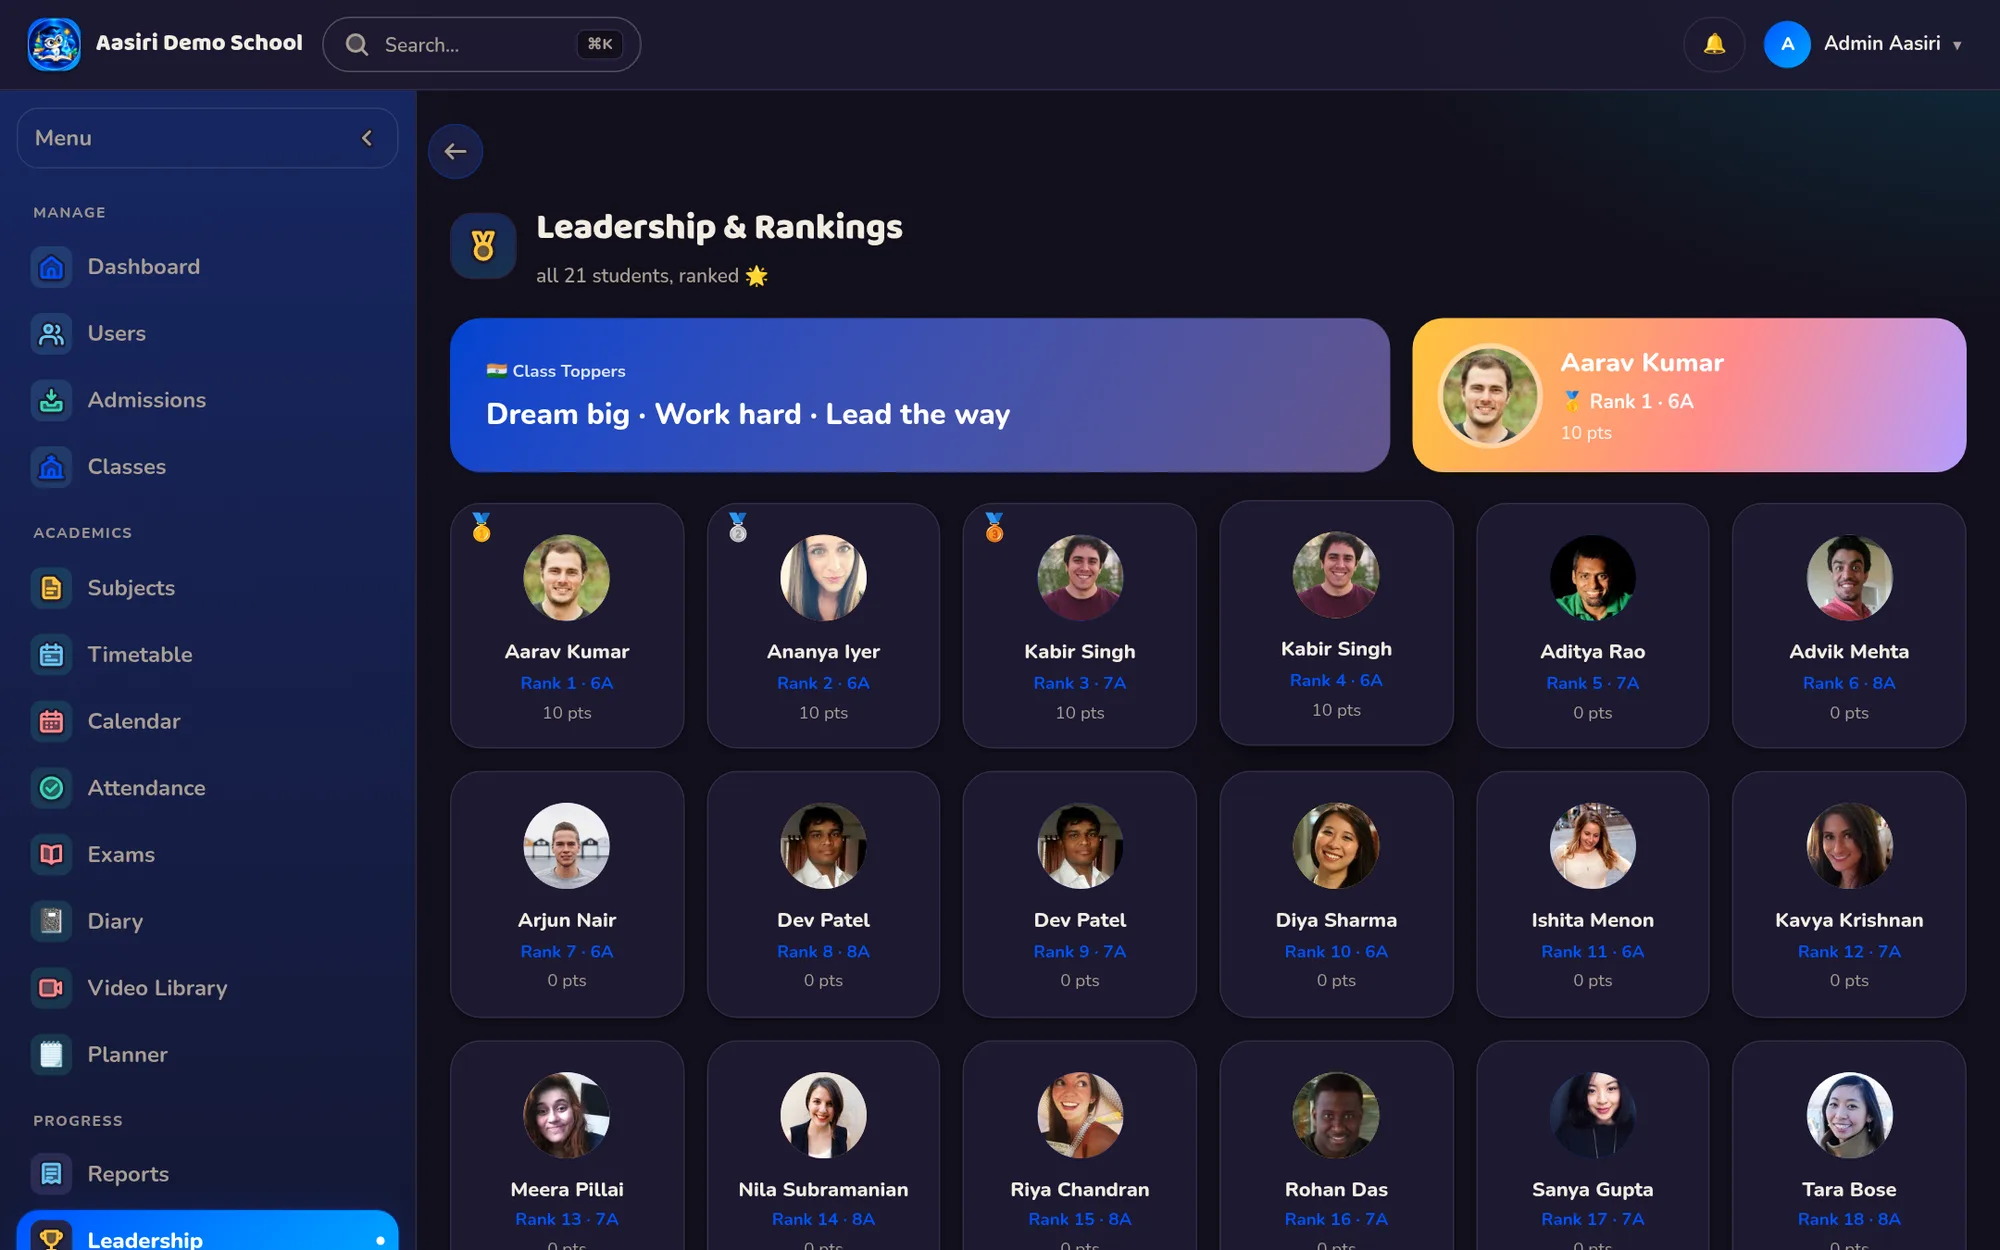
Spot your top classes at a glance, and recognise the teachers and students behind them.
Small decisions that only come from watching a real school run.
Dashboard figures come from records already kept in Aasiri: enrolment, attendance, fees and exam marks.
Attendance and report-card records are permanent, with corrections tracked, so the numbers rest on reliable records.
Role-based access controls who sees what, and each school's data is isolated from every other school.
The audit log records who changed which grade, fee or attendance record, and when.
The analytics dashboard shows enrolment, attendance trend, fee collection, pass rate, grade distribution and top classes. Everything comes from records kept in Aasiri.
No separate preparation is needed. As teachers mark attendance and enter marks, and as fees are recorded, the dashboard draws on those same records.
Aasiri uses role-based access, so school data is visible only to the roles meant to see it. Each school's data is also isolated from every other school's.
Attendance records and report-card marks are permanent, and corrections are tracked rather than overwritten. The audit log shows who changed which record and when.

A 30-minute demo with your classes, your fee structure and your bus routes. No obligation.